-
Average Income per capita
-
Number of Individuals/Families at Risk of Poverty
-
On Index
1.2 Household Income
1.2 Household Income
Average Income per capita
1.2 a. Average Income per capita
This graph shows the development of average income per capita in the central area compared to the eastern area, the western area and the whole country.
Source: Statistics Iceland
Number of Individuals/Families at Risk of Poverty
1.2 b. Number of Individuals/Families at Risk of Poverty
Risk of poverty is considered 60% of the median disposable income. Guidelines on risks of poverty were as follows:
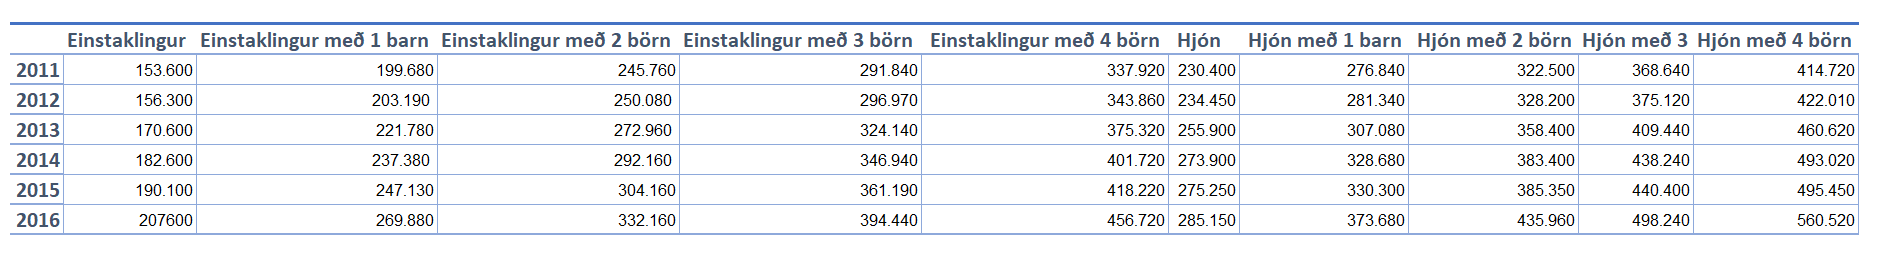
Original data and processing cannot be published due to how few people were in the group in individual municipalities in the central area.
On Index
The index gives an idea of the economical situation of the population in comparison to elsewhere in the country. Median income and risk of poverty are practical measurements to compare the financial wellbeing in different areas. A power station, industrial manufacturers and tourism are likely to influence the development of income in the central area. The influence of companies on the income in the area can both be direct and indirect because of induced jobs within the area.
The index will publish information on the median income of inhabitants in the central area along with information on the number of individuals and families that land in the defined area of risk of poverty.
Frequency
Data on median income and risk of poverty will be published yearly and no later than 15th of August.
Area
Central, eastern, western and Iceland.
Accountability
The project manager is responsible for acquiring the data and publishing it according to the publishing schedule.
Source Material
Data will be collected from Statistics Iceland and the Directorate of Internal Revenue.