-
Waste Management and Disposal
-
Treatment of Sewage
-
Local Status of Vehicle Fleet
-
On Index
2.7 Consumer and Production Pattern
2.7 Consumer and Production Pattern
Waste Management and Disposal
In 2015 a Regional plan on waste management in the North of Iceland 2015-2026 was made.
The regional plan applies to all municipalities in the Sustainability project's monitored area. Until 2014 the municipalities Norðurþing, Skútustaðahreppur, Þingeyjarsveit and Tjörneshreppur had a common waste collection cooperative. The cooperative was responsible for planning waste collection in the area in collaboration with Gámaþjónusta Norðurlands (a container service) and others. In 2006-2013 a waste incinerator was operated in Húsavík. The waste collection cooperative also ran a sorting and baling station for waste from homes and operations along with a reception for hazardous waste. After the waste incineration was stopped in 2013, waste from homes and operations was driven to a landfill in Stekkjarvík by Blönduós. Recyclable and hazardous waste was sent to Akureyri for further sorting. At the end of 2014 the collaboration on waste management in Þingeyrjarsýsla municipalities stopped and the waste management went to each municipality in the area. (More information in the Regional plan).
Because of the way waste management was and the changes in the municipalities collaboration at the time of monitoring, it has proven difficult to get numeric information on waste and its trajectory. Below are all the information collected.
2.7 a. The Amount of Waste
The figure shows the total amount of waste in the municipalities of Norðurþing, Skútustaðahreppur and Þingeyjarsveit.
Information for 2014 and 2015 is missing for Norðurþing, 2011-2016 for Þingeyjarsveit, and 2011-2016 for Skútustaðahreppur.
The numbers for Norðurþing apply to Húsavík and Reykjahverfi.
Source: Norðurþing, ÞIngeyjarsveit
Data is collected from the municipalities employees.
Treatment of Sewage
According to regulation no. 789/1999, local board of health attends to sewerage and sewage as well as monitoring sewerage.
Results of samples taken in August 2021.
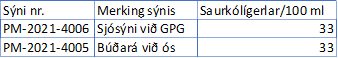
"Sjósýni við GPG" is a sample from the ocean taken at the same location as sample 11 on the map below.
"Búðar við ós" is a sample taken at the same place as sample 12 on the map below.
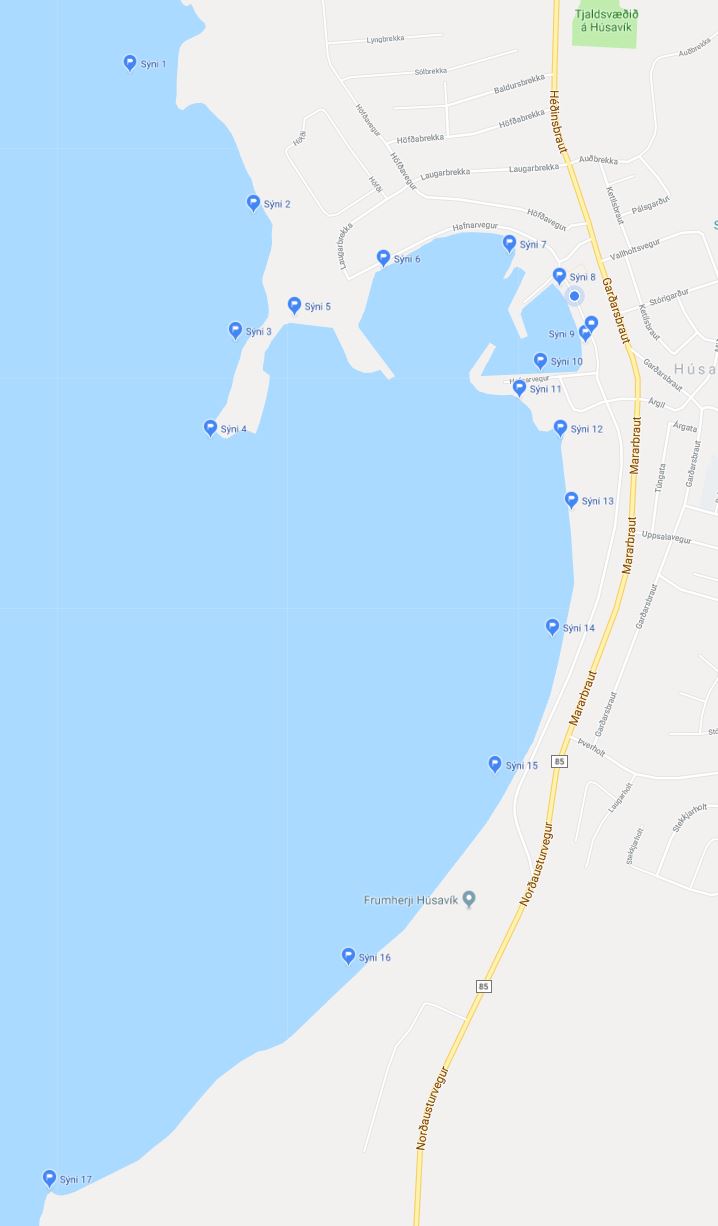
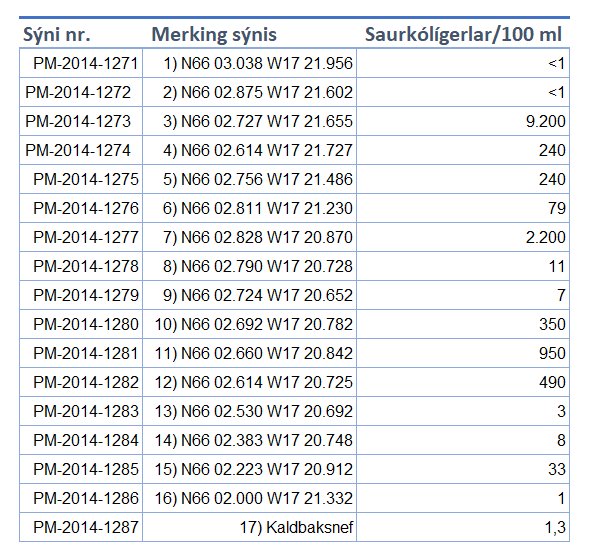
Table The table below shows the locations of sampling sites and the number of fecal coliforms in 100 ml. Sampling took place in 2014.
Environmental limits
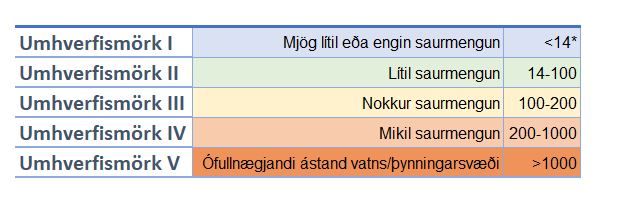
*E-coli can in 10% of incidents go up to 43 bacterium pr. 100 ml. (43/100 ml)
Local Status of Vehicle Fleet
2.7 f. Meðal útblástursgildi bifreiða (CO2)
The emissions value of vehicles is provided in CO2. There is a considerable number of cars in the vehicle registry where the emissions value is not registered. This applies to cars from before 2001.
In 2024, 2380 vehicles out of 4315 were registered with emissions values or % of vehicles.
In 2023, 2418 vehicles out of 4190 were registered with emissions values or % of vehicles.
In 2022, 2291 vehicles out of 4156 were registered with emissions values or 53% of vehicles.
In 2021, 2256 vehicles out of 4021 were registered with emissions values or 53% of vehicles.
In 2020, 2175 vehicles out of 4081 were registered with emissions values or 53% of vehicles.
In 2019, 2057 vehicles out of 4006 were registered with emissions values or 51% of vehicles.
In 2018, 1701 vehicles out of 3796 were registered with emissions values or 48% of vehicles.
In 2017, 1722 vehicles out of 3691 were registered with emissions values or 47% of vehicles.
Source: Samgöngustofa
Special processing for Gaumur, done by Rögg ehf.
On Index
It is important that waste management causes as little undesirable environmental impact as possible.
The sea's ecosystem by the coast of Iceland is unique and diverse. Sewerage from residential areas and operations can impact the marine life and it is therefore important to manage sewage in a way that the environmental impact of the sewage system is as small as possible.
It is interesting to monitor the vehicle fleet and whether or not it follows the development of the country as a whole in that vehicles running on fossil fuels decrease proportionally. It is also interesting to monitor whether fuel efficiency goes up and emissions value down.
The amount of waste and its trajectory, the total amount of waste per capita (in certain categories like recycling, destroying (landfills or incineration) and organic) will be published in this index.
Information will be published on fecal pollution in surface water because of sewerage, the amount of heat-resistant coliform, e-coli bacteria or enterococcus that should in 90% of cases be less than 1000 per 100 ml in at least 10 samples. Where food industry is close by the number of bacteria and coccus should be under 100 per 100 ml. in at least 10 samples.
Information on the number of vehicles, age of vehicles, fuel efficiency, fuel type and emissions value will be published.
Frequency
Yearly.
Area
Central area.
Accountability
The project manager is responsible for acquiring the data and publishing it according to the publishing schedule.
Source Material
Data will be collected from municipalities in the central area, the Public Health Authority in North East Iceland, The Environment Agency of Iceland and the Icelandic Transport Authority.